0.9m Filter List and Exposure Time Estimates
___________________________________________________________________________
This is a list of common filters used in the CCD camera at the CTIO
0.9m since SMARTS began. For additional filter options, see
http://www.ctio.noao.edu/instruments/filters/index_34.html
http://www.ctio.noao.edu/instruments/filters/index.html
Additional valuable information can be found at
http://svo2.cab.inta-csic.es/theory/fps3/index.php?mode=browse&gname=CTIO&gname2=CTIO
___________________________________________________________________________
STANDARD FILTER SETS
___________________________________________________________________________
size wave wave peak notes
central FWHM trans%
U (Johnson) 3x3" 3570 660 80.59 from Tek #2 set
B (Johnson) 3x3" 4202 1050 66.16 from Tek #2 set
V (Johnson) 3x3" 5475 1000 87.71 from Tek #1 set *
R (Kron-Cousins) 3x3" 6400 1450 81.09 from Tek #2 set
I (Kron-Cousins) 3x3" 8118 1415 96.63 from Tek #2 set
* Tek #2 V filter cracked --- can be used for quarter chip work
g (Gunn) 3x3" 5118 900 81.39 Gunn-T
r (Gunn) 3x3" 6728 1000 93.83 Gunn-T
i (Gunn) 3x3" 8100 1500 93.00 Gunn-T
z (Gunn) 3x3" 9900 n/a 95.50 Gunn-T
u (Stromgren) 4x4" 3530 280 37.14
v (Stromgren) 4x4" 4118 146 52.04
b (Stromgren) 4x4" 4697 196 71.27
y (Stromgren) 4x4" 5478 244 70.83
___________________________________________________________________________
SPECIAL FILTERS
___________________________________________________________________________
Halpha-1 3x3" 6559 64 89.37
Halpha-2 3x3" 6598 69 87.77
ND1 neutral density, attenuation by = 2.5 MAGNITUDES
ND2 neutral density, attenuation by = 5.0 MAGNITUDES
ND3 neutral density, attenuation by = 7.5 MAGNITUDES
ND4 neutral density, attenuation by = 10.0 MAGNITUDES
It is also possible to combine two ND filters to achieve additional
attenuation, e.g. ND2 + ND4 = 15.0 MAGNITUDES.
___________________________________________________________________________
ESTIMATING EXPOSURE TIMES
___________________________________________________________________________
Tests of the 0.9m CCD camera response were carried out through UBVRI
filters on 24 FEB 2006 during engineering time. Landolt standard
stars in field SA 104 were targeted to determine how the 0.9m is
actually counting photons after the TCS upgrade and mirror cleaning.
Observations of the field on started at 05:07:14 CTIO local time and
ended at 05:48:49, already beyond the twilight limit (around 5:00 AM).
The airmass varied from approximately 1.3 to 1.4 during this sequence.
For details of the observability of this particular field at the given
date check here.
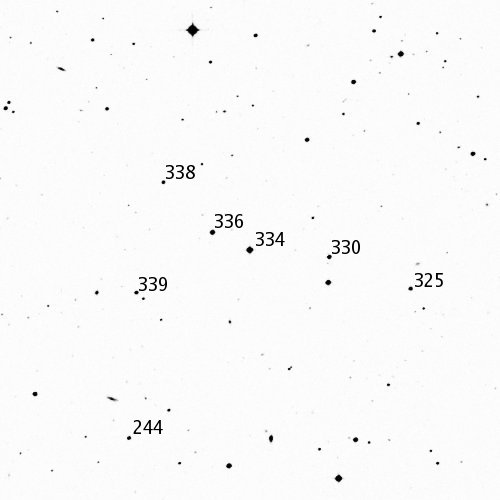
Seven Landolt standard stars were examined:
---------------------
Star V Mag
---------------------
SA 104-334 13.484
SA 104-336 14.404
SA 104-330 15.296
SA 104-339 15.459
SA 104-325 15.581
SA 104-244 16.011
SA 104-338 16.059
---------------------
Figure 1: Finding chart for Landolt field SA 104.
Three exposure times were used --- 10, 100, and 200 seconds --- in
each of the UBVRI filters in the Johnson-Kron-Cousins set listed at
the top of this page. Each image was corrected using a bad pixel mask
obtained using flats from the same night. The raw images (not
flat-field or bias corrected, but having very low backgrounds of about
1 ADU/s in V, see Table 1 for details) were used to determine the
count flux in ADU/s for each of the Landolt stars with known
magnitudes.
Table 1. Determined Background and FWHM.
-------------------------------
Filter Background FWHM
ADU/s (pixels)
-------------------------------
U 0.0 4.03
B 0.5 4.46
V 1.2 4.03
R 5.4 3.82
I 21.2 4.50
-------------------------------
Note 1: The scale of the 0.9m CCD camera is 401 mas/pixel, so the
seeing was ~1.6".
Note 2: the steep increases in ADU/s for the background flux in the
filters R and I are presumably because the observations through these
filters were at the end of the night, as sunrise approached.
The relationships between magnitudes and fluxes shown in Figure 2 were
then constructed for each filter. The fitted relations, which can be
used to estimate integration times (note that variable seeing better
or worse than the 1.6" seeing experienced in this experiment must also
be considered), were of the form
log(flux)=A1+A2(mag).
Table 2. Coefficients for CCD response.
----------------------
Filter Coefficients
A1 A2
----------------------
U 7.75 -0.39
B 8.70 -0.41
V 9.42 -0.45
R 8.93 -0.41
I 9.09 -0.45
----------------------
Figure 2: Data values and the fits for each filter
Figure 2 in postscript format
___________________________________________________________________________